

Care cost calculator suggests care homes are 65% more expensive than “age-proofing” homes with independent living equipment
Aiming to shine a light on the difference in costs between moving into a residential care home and purchasing and installing independent living products to future-proof homes, Mira Showers has unveiled a new cost calculator which has indicated ‘age-proofing’ could be significantly cheaper and more desirable.
Created by Mira Showers, the calculator estimates the cost of age-proofing properties with the purchase and installation of independent living and mobility and compares the cost against regional average figures for residential care home costs with/without nursing from LaingBuisson’s Care of Older People UK Market Report.
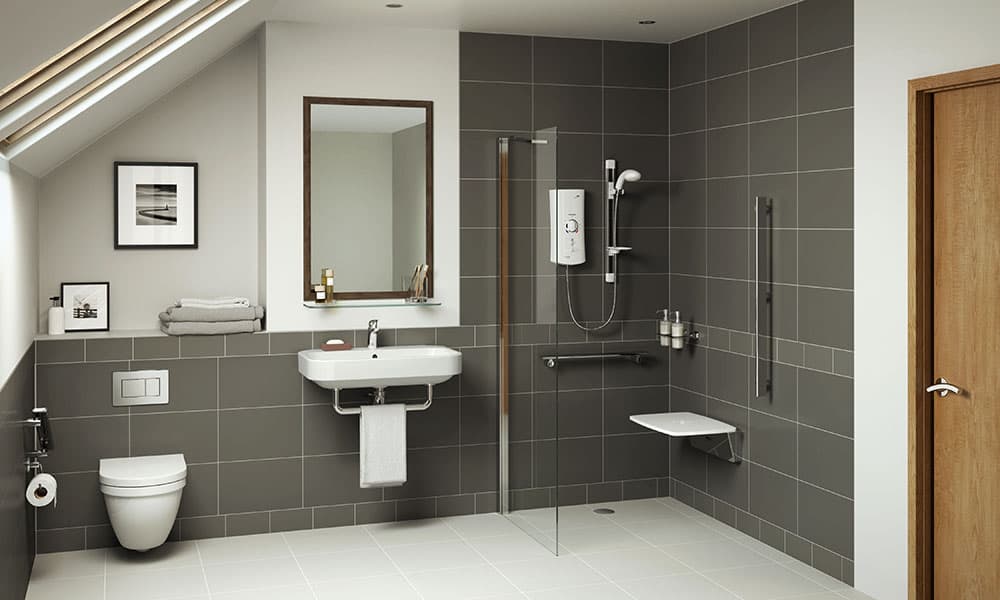
The basic ‘age-proofing’ costs reflected in the calculator include £2,200 for an adjustable double bed, £899 for a riser recliner, bathroom installation costs for each UK region quoted by local installers, as well as a combined £1,523.83 for various Mira Showers’ Independent Living bathroom products, including a shower tray, grab rail, and shower seat.

In addition, the calculator also gives the option for users to include average costs for fitting non-slip flooring (£336.76) and stairlifts (£3,475.00) if required, as well as full-time and part-time nursing care options for both at-home and residential care home living.
Analysis by Mira of the cost calculator results comparing age-proofing to nursing home costs suggests age-proofing could be 65 percent cheaper on average for homeowners.
Whilst annual residential nursing home fees are highlighted as being initially the cheaper option in the North East, Yorkshire and the Humber and Northern Ireland, Mira’s analysis notes that by scaling residential nursing care costs over five years (and accounting for three percent fee rises in line with inflation), it is 28 percent cheaper on average to receive full-time care at home and benefit from investing in ‘age-proofing’ solutions, no matter where you live in the UK.
The company pointed out that the calculator results are indicative and for guidance only however, with actual residential care home costs dependent on the specific care home chosen, the type of care required, the specific care home’s annual fee increase and how long care is required for.
According to Mira Showers, the calculator was created in response to the UK’s growing ageing population, with forecasts predicting that the number of over 67-year-olds will grow by over 30 percent between 2016 and 2041, heightening the need for people to prepare for older age.
A survey commissioned by the Independent Age charity found fewer than one in four homeowners are saving for their future care needs, despite facing high care costs in the future, whilst research by Mira Showers in May 2018 highlighted that 87 percent of over-65s wish to grow old independently.
Matt Herbert, Senior Market Analyst for Mira Showers said: “This calculator changes the game for the ageing population. For many, growing old at home seems like a pipe dream. But in terms of costs, it could actually work out better for them in the long run. This tool puts the choice firmly back into the hands not only of those who want to stay at home, but also those who haven’t been able to get the care home place they wanted.”
See the full results of the Mira Shower cost analysis below:
| UK region | Age-proofing vs residential care home annual fee |
Age-proofing and PT care vs residential care home annual fee |
Age-proofing and FT care vs residential nursing home annual fee |
Age-proofing and PT care vs residential care home over 5 years |
Age-proofing and FT care vs residential nursing care over 5 years |
|---|---|---|---|---|---|
| South East | 67% | 38% | 21% | 67% | 42% |
| East Anglia | 73% | 42% | 24% | 66% | 41% |
| London | 66% | 37% | 12% | 67% | 36% |
| South West | 65% | 33% | 17% | 64% | 38% |
| West Midlands | 56% | 20% | 5% | 58% | 31% |
| East Midlands | 69% | 33% | <1% | 61% | 23% |
| Yorkshire and the Humber | 64% | 27% | -0.5% | 59% | 23% |
| North West | 60% | 19% | 3% | 55% | 26% |
| North East | 67% | 30% | -11% | 60% | 14% |
| Wales | 68% | 32% | 3% | 60% | 24% |
| Scotland | 71% | 40% | 8% | 66% | 29% |
| Northern Ireland | 59% | 18% | -16% | 55% | 12% |
| UK Average | 65% | 31% | 5% | 62% | 28% |